US PORTFOLIO SHOWCASE
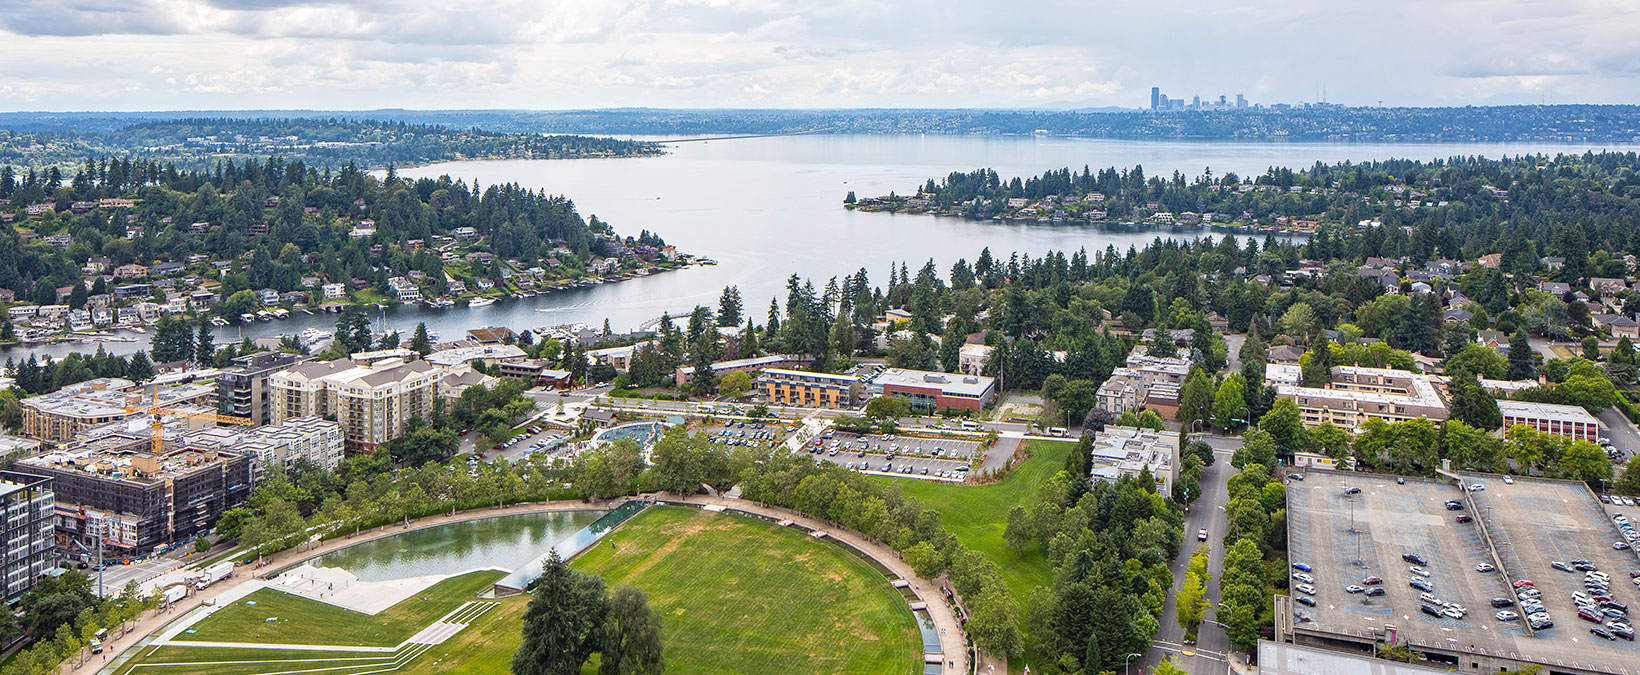
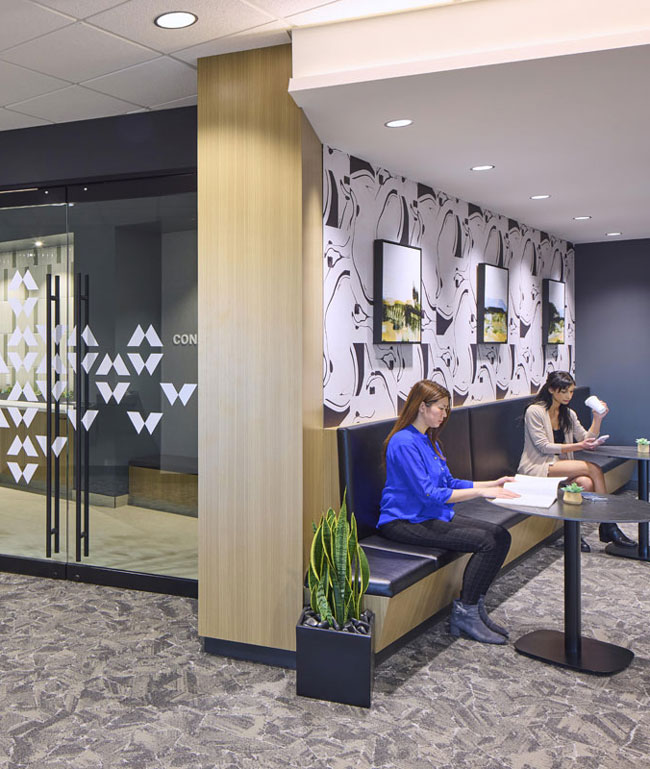
Distinctive portfolio of quality freehold office buildings and business campuses across eight growth markets in the US.
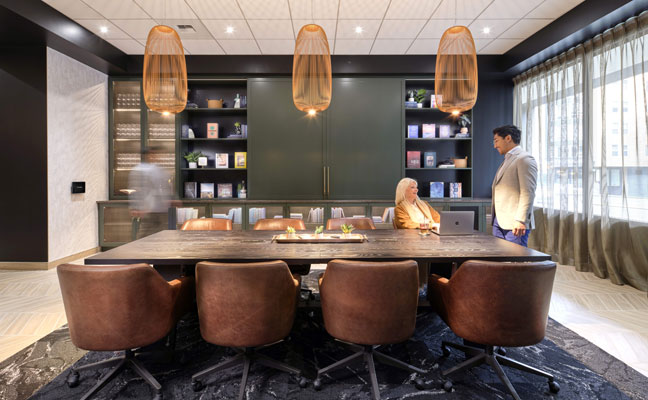

Distinctive portfolio of quality freehold office buildings and business campuses across eight growth markets in the US.
Key growth markets with positive economic and office fundamentals
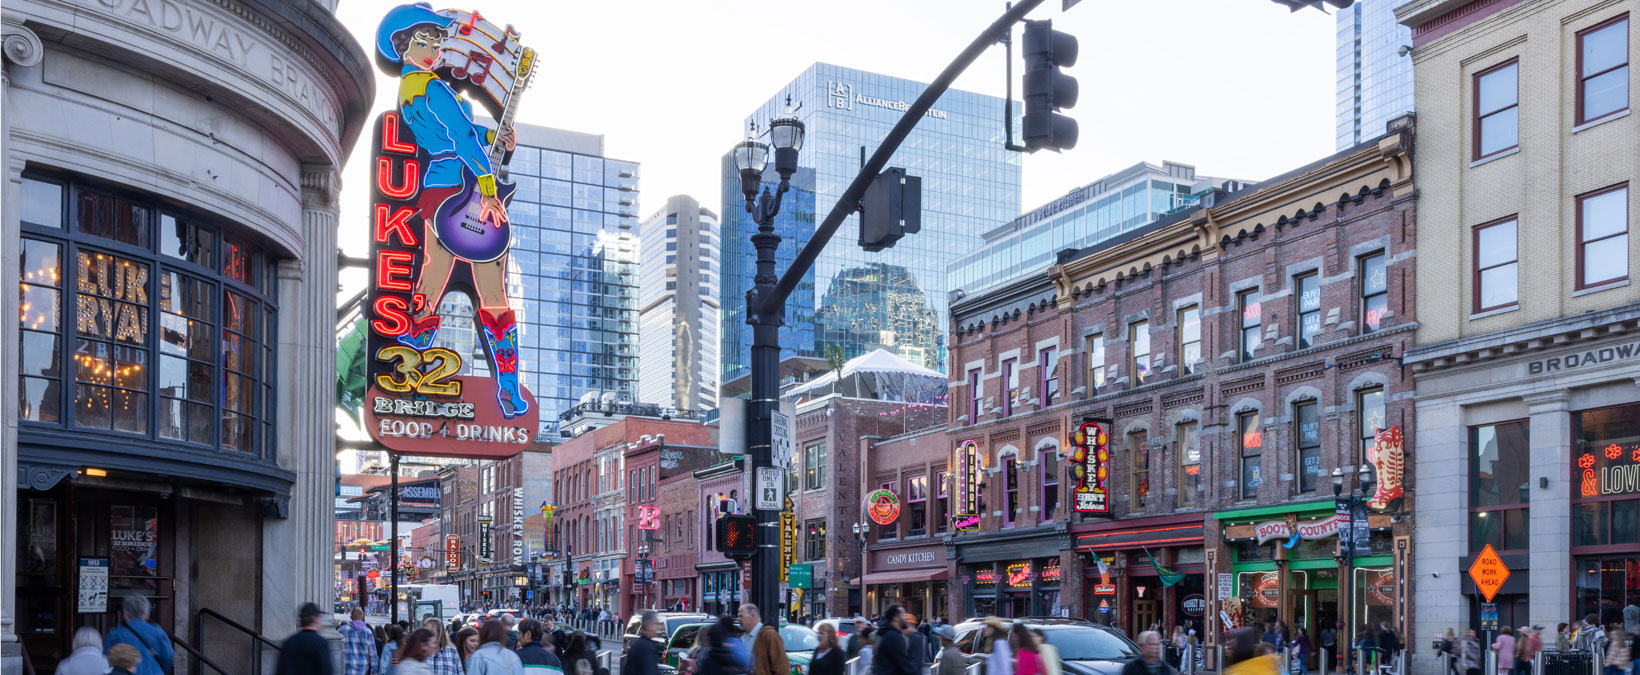
Exposure to the fast-growing TAMI, medical and healthcare sectors
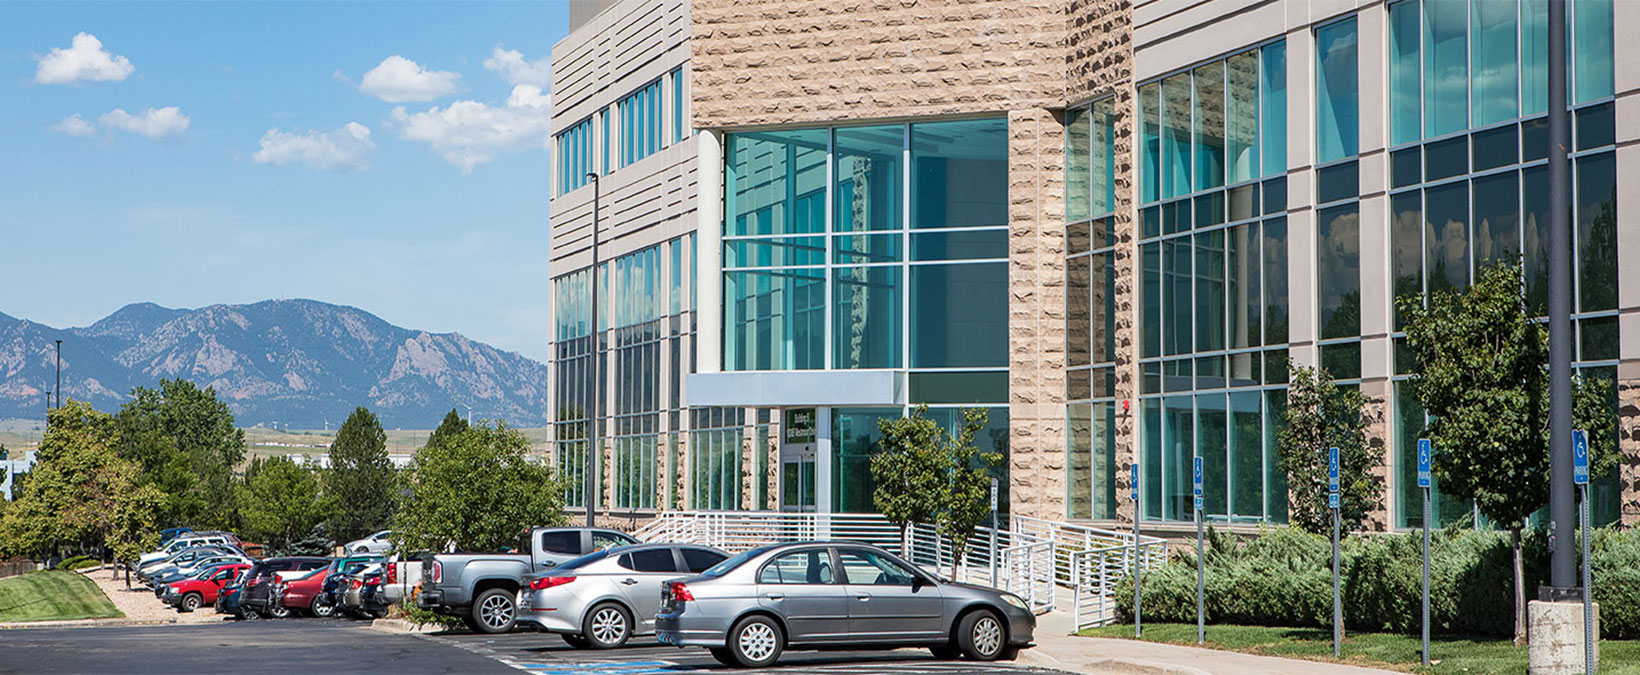
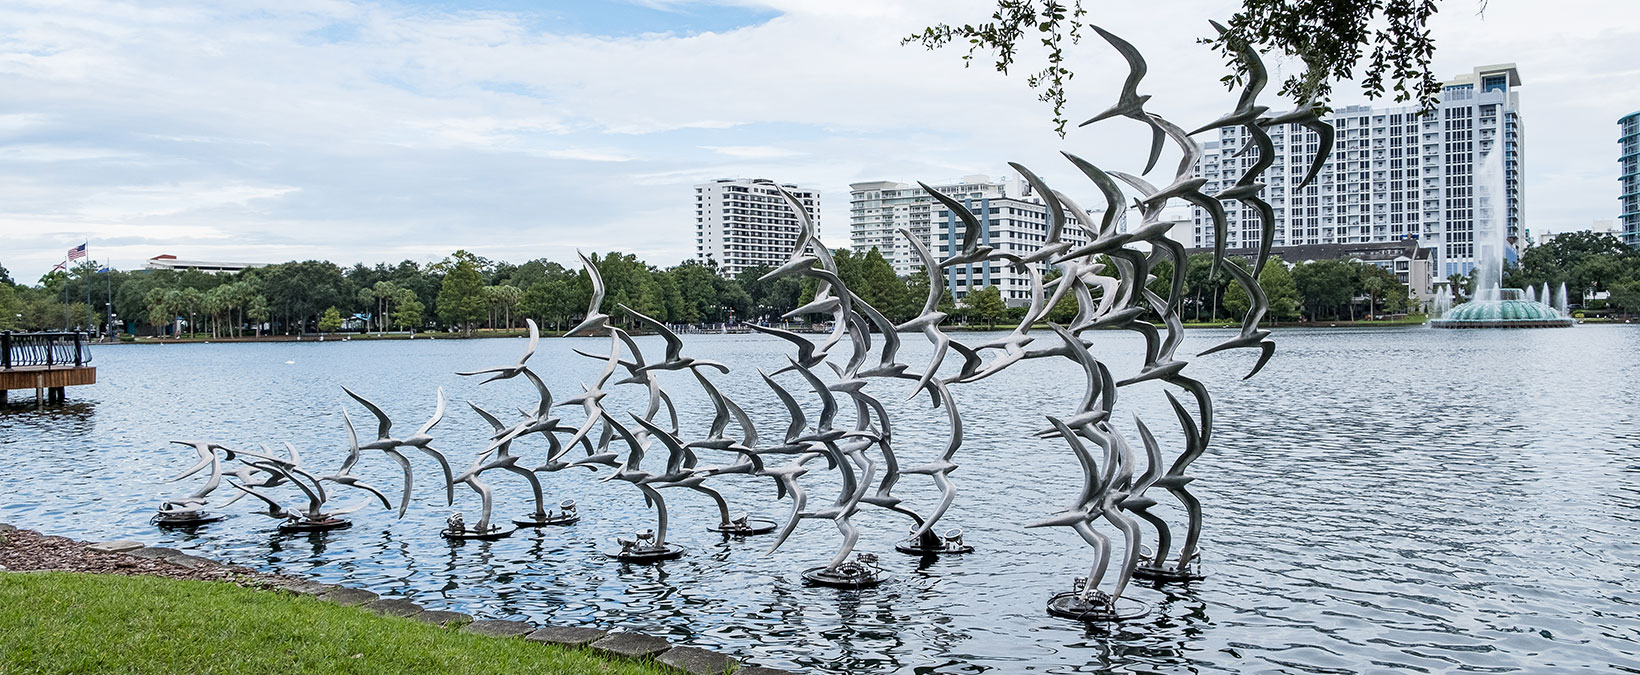
Attractive location and on-site amenities that decision makers and talent desire
High quality lease and financing structures that offer stability
Proximity to prestigious universities and educated talent pools
Accessibility to alternative transit options